正確な評価を行うには、経験とシステムへの理解が必要
分析は、アラートとイベントのログデータに、過去の監視データの履歴を組み合わせて行う。太陽光発電システムの監視データの分析により、不具合の積極的な発見に留まらず、発電所の実際のパフォーマンスの状況評価と、是正措置による発電所効率の向上と発電量アップに繋がる。
収集データは細心の注意を払って扱うべきで、正確な評価を行うには豊富な実経験と太陽光発電システムに関する深い理解が必要とされる。検討が必須となる項目は下記を含む。
●外部要因による影響は本分析から省く。系統不良、積雪、発電所の不適切な運用等による発電量低下について除外する。
●測定日射量は性能比(PR)計算において信頼性が低いケースが多い。これは、2級レベル※1 の全天日射計が使用されていたり、センサーの設置射角が不適切だったり、もしくはセンサー機器に影がかかっていたりすることによる。
●データ分析から問題の特定までの的確なストラテジーは複雑で、導入されている監視システムのタイプと入手可能なデータセットに依存する。
※1日射計の性能はISO9060で3階級に区分されている。最高レベルは「Secondary standard」(二次標準)で、「First class」(一級)、「Second class」(二級)と次ぐ。
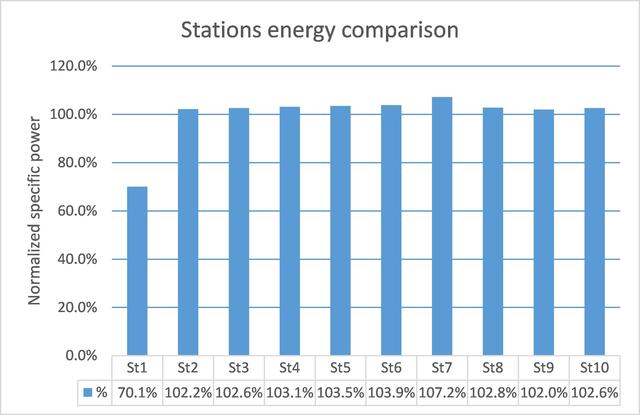
下記の棒グラフは、日本国内の南エリアに所在する太陽光発電所で稼働中のパワーコンディショナ10台の電力比較を示したものである。図表1は、ステーション1(St1)の2016年の発電量が他のパワーコンディショナに比べて低下している状態を示しているが、全ての外部要因を除外して評価した結果、問題もしくは是正の可能性は、ステーション2(St2)で発生していることが判った。(図表2)
[図表1]パワーコンディショナ10台の2016年正規化比エネルギー発電量
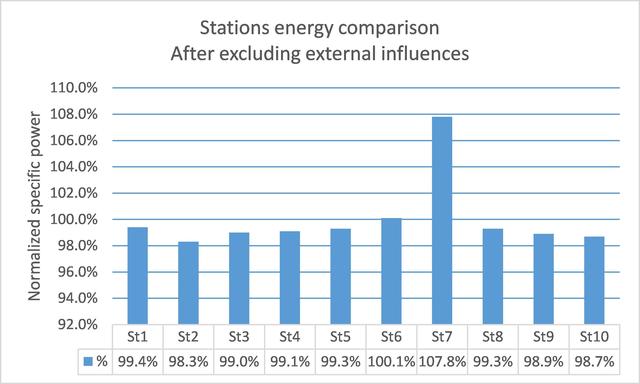
[図表2]外部要因を除外した後の2016年正規化比エネルギー発電量
発電量予測を誤ると、資産運用計画が大きく狂うことに
発電量予測は、融資を受ける際の、収益性分析モデルと内部収益率の計算に用いられる。発電量予測が正しく実施されなかった場合、実際の発電量との間にギャップが生じ、資産運用計画の大きな食い違いに発展する恐れがある。
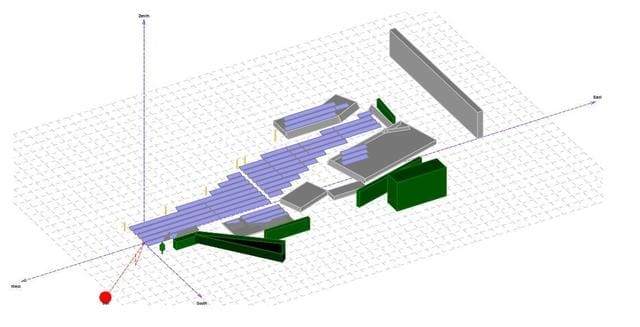
影の原因となる遮蔽物の評価と、シミュレーションソフトウェアへの反映は、特に日本国内では複雑※2になりがちである。遮蔽物に関する誤った評価は、重大なエラーを引き起こす恐れがある。2%以上過大評価されているケースも少なくなく、気象データの的確な審査と不確実性の検討が必須だ。
※2平坦かつ開かれた土地が少ない為、傾斜角・遮蔽物による影響を受けやすい。
計画が不十分な場合、例えば発電所の工事内容(竣工内容)がシミュレーションで考慮した設計図面と異なる等により、シミュレーション結果との間に大きな先が生じる場合もある。
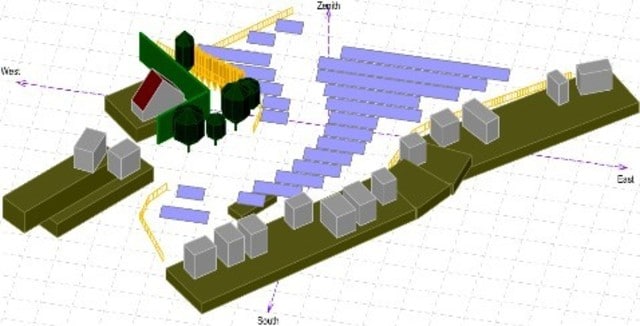
下記2点の画像で分かるように、太陽光発電所における影の分析は比較的複雑になる場合がある。
太陽光発電所における影の原因となる遮蔽物のスクリーンショット
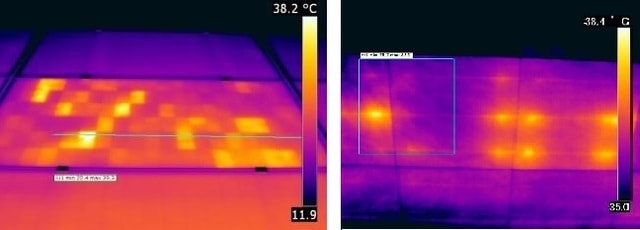
現場調査を実施して、施工品質と竣工図面の検証を行う。特に、データ分析で低パフォーマンスの発生を発見した部分については、不具合が発生している部品(PVモジュール等)を特定するため、追加で測定する。
また、サーモグラフィ検査も、太陽光発電システムの性能に大きな影響を与え得る問題を特定する上で有益である。
[図表]PVモジュールのサーモグラフィ
この20年でPVモジュールとパワーコンディショナが継続的に改善されており、近年特に著しい進歩を遂げている。
例えば、2年前に建設されたばかりの発電所のパワーコンディショナの最大効率が94%だったのに対して、今日では99%まで改善されている。また、1台のパワーコンディショナ内に複数のMPPTを収集できる新技術も開発されており、すでに発電中の太陽光発電所においても高い費用対効果を発揮し得る、新しい投資機会といえる。
当初のシミュレーションにエラーが・・・
2015年に竣工した太陽光発電所を例に挙げる。
発電量調査の結果に基づき投資プランを計画したものの、運用開始初年度の発電量が投資家の予測を下回ったケースを想定した。
そこで、詳細な調査を実施し、太陽光システムの発電量低下に影響を与える外部要因を省き分析をした結果、当初の発電量シミュレーションにエラーがあったことが判明した。
複数の遮蔽物について正確に反映されておらず、パワーコンディショナの効率曲線が適正ではなかったことが判った。修正後のシミュレーション結果は、当初の発電量予測を3%下回った。これについて、次の改善案が考えられる。
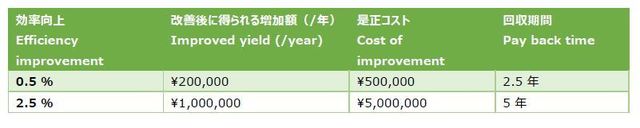
1.太陽光発電所の南側の樹木について枝を刈り込みしたケースを想定した場合、一年目の発電量が0.5%増加する結果となった。本作業にかかる費用の回収期間は2年間だった。
2.また、新技術により、既存の中央型パワーコンディショナについて、10台のパワーコンディショナに置き換える。影の影響を受けているストリングについて、できるだけ少数のMPPTに集約することで、より発電効率の高いストリング構成が可能になる。中央パワーコンディショナを使用した場合と比較して、一年目の電力が2.5%アップすることが見込まれる。この是正にかかるコストの回収期間は5年間だった。
[図表]太陽光発電所の改善案
(参考:原文掲載)
MONITORING DATA ANALYSIS
In combination with the alarm and event logs the historical monitoring data will be analyzed. The analysis of the monitored data from a photovoltaic system can be used not only to proactively identify failures, but also to assess the real performance of the plants and to evaluate whether corrective activities can improve the plant efficiently and consequently the energy yield.
Data shall be handle carefully, practical experience and deep knowledge of photovoltaic systems is fundamental to correctly assess the collected data. Some considerations are mandatory:
-External influences are not interesting for the analysis. Energy losses due to grid failures, snow coverage, improper operation of the plant, must be excluded.
-Irradiation measurements are often not reliable for performance ratio calculation (use of second class pyranometers, wrong tilts of sensors, shadowed sensors, etc.)
-The correct strategy to identifying issues starting from data analysis is complex and often depends on the monitoring system solution and available data set
The following diagrams show the energy comparison between 10 inverters of one plant located in South Japan. While 図2 shows that station 1 has been strongly under-performing compared to the other stations across 2016, after accurately assess the data and having excluded all external factors, it is clear that issues and/or improvements possibilities, have to be researched instead at station 2, 図3.
SIMULATION AND SHADING ANALYSIS
Energy yield predictions are used in the profitability analysis models for bankability and calculation of the IRR. If energy yield simulation are not properly done, important discrepancies to the real yield can be expected and consequently the financial plan for the project can show considerable differences.
The assessment of shading objects and their proper reproduction in simulation software is, especially in Japan, often a complicated task. Incorrect estimation of shading objects can lead to important errors, with easily above 2% over-estimations of the yield. A proper evaluation of the meteorological data and considerations about uncertainties are also very important.
Poor planning can also produce important discrepancies with simulation results, when for instance the constructed plant (as-built) will not match to the design layouts used for the simulation.
The images below show how complex might be the shading analysis of a PV plant.
ON SITE INSPECTION & MEASUREMENT
During On-Site inspection construction quality and quality of as-built documentation are verified. Evidence of poor performance during the data analysis, might introduce the need of additional measurements which should be executed to detect components (e.g. PV modules) with failures.
Thermographic inspections are often used to identify issues which may importantly affect the performance of the solar power systems.
REPLACEMENT WITH NEW TECHNOLOGY COMPONENTS
Recently,important results have been obtained in terms of improved technology. Modules and inverters efficiency have been increasing continuously within the last 20 years.
It is common to find plants built only two years ago with inverters having a maximum efficiency of 94%, while now available inverters could work with the efficiency close to 99%.
This advantage, together with the possibility to have several available MPPTs within one inverter, can be considered as a new investment opportunity within existing photovoltaic plants.
CASE STUDY
A PV system was built in 2015 and a yield simulation was provided to support the financial plan. Since the first year the yield didn’t match the Investor expectations.
A detailed assessment has been carried out. After excluding external factors which effect the yield of the PV system, important incorrect estimates have been found at the yield simulation.
Several shading objects were not estimated properly and inverter efficiency curves were not considered accurately. A more accurate simulation has shown a 3% lower yield than the expected.
Two improvements have been considered:
1.The first improvement includes the cut of a band of trees on the south side of the PV plant.A simulation of the improvement has been provided and showed an increase in yield of approximately 0.5% for the first year. After evaluating the economic proposals, a payback time (PB) of two years was estimated.
2.Thanks to new available technology, a proposal considering the replacement of one central inverter with 10 string inverters have been done. The proposal include the strategic distribution of string inverter to cover the shadowed areas with the minimum quantity of MPPT. A better efficiency of the string inverters compared to the installed centralized helped to simulate a 2.5% improvement of the yield for the first year. After evaluating the economic proposals, a payback time (PB) of five years was calculated.