フラッシュ試験による測定結果は変動が生じるケースも
PVモジュールの性能は通常、+5Wの幅に区切られ(例:265W~269.99W)、製造工程の最終段階におけるフラッシュ検査の結果により振り分けられる。しかし、フラッシュ試験による測定結果は発光毎に変動が生じる場合がある。例えば、265Wのモジュールの受入検査の測定結果が、264.6Wを示す場合がある。これは定格電力265Wのモジュールであればその特性に反するものではないと考えられるが、無作為に選別したモジュールの測定結果の平均出力値を用いることが推奨される。
出力が265W~269.99Wの+5W幅に振り分けられたモジュールは、連続的かつ均一に分布し、期待される平均値は267 W(+0.7%)である場合が多い。しかし、過去には良い場合は265W(+0%)で、代表的なサンプルが262W(-1%)、好ましくないサンプルは257W(-3%)というケースもあった。
[図表1]LEDフラッシャーで観測したIV曲線(電流が電圧に依存)と出力曲線(電力が電圧に依存)【IV curve (current in dependence of the voltage) and power curve (power in dependence of the voltage) measured with the LED flasher】

セルのクラック発見が期待できるEL画像検査
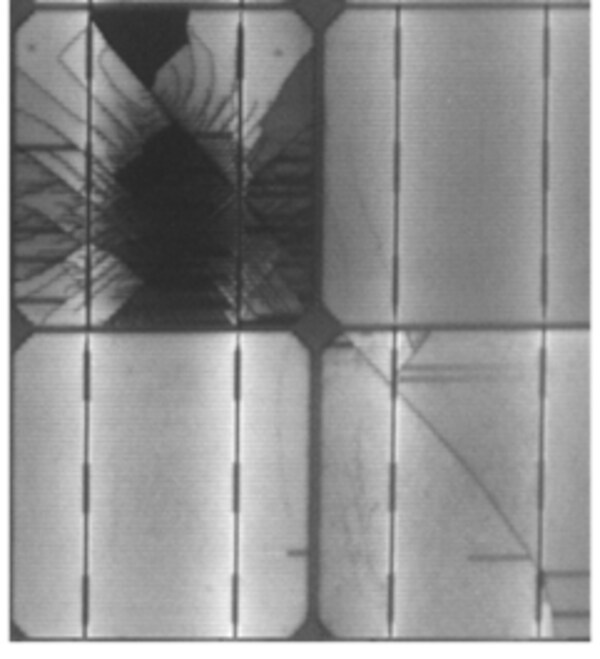
EL画像検査による、主な発見項目としてセルのクラックが挙げられる。セル素材に生じた物理的なひび割れが細い線として画像に映し出される。EL画像検査は製造元の工場における品質管理の一環として実施されているが、メーカーによる品質検査実施後から発電所予定地におけるモジュール設置までの間に発生し得るクラックについてはノーチェックだ。輸送中、手荒なハンドリング、内在する応力などによりひび割れが発生する可能性がある。モジュール受入検査において、セル総数の内1個~2個にクラックが発生しているモジュールが、全モジュール枚数の20%以下であれば、状態は良好であると言える。
[図表2]4枚のセルのEL画像【electroluminescence (EL) image of four cells.】

太陽光発電所の運転開始から1年目は、クラックによる発電量への影響はないと一般的に考えられる。しかし長期的な運用において、クラックによりセルの一部が発電できなくなるだけでなく、他のセルに流れ込む電流により正常な箇所が追従的に破損する恐れがある。最悪の場合、ホットスポットによりPVモジュールの破損が生じることもある。
(参考:原文掲載)
Expected results on the power output
PV modules are commonly sorted in +5 W bins, like for example 265 W to 269.99 W. The sorting depends on a flash test measurement at the end of the production process. Unfortunately, the results for the power output determined in a flash test are variating from flash to flash for the same PV module. That is, a measurement results of 264.6 W in an Incoming Goods Test (IGT) is not violating the requirement for a 265W-labled PV module. It is more meaningful to regard the average power output of a random sample.
The power output of the PV modules in the +5W bin from 265 W to 269.99 W will be almost distributed continuous uniform distribution with a small lack of modules near the 270 W limit. The expected average value is 267 W (+0.7%). The experiences with IGT show other results: The measured average power output is for good sample 265 W (+0%), for typical samples 262W (-1%) and for typical bad samples 257 W (-3%).
Expected results on the electroluminescence (EL) images
Very typical findings in electroluminescence (EL) images are cell cracks. The cracks can be seen as thin lines in the images and indicates a physical fracture of the cell material. Cracks can be detected with EL images by the quality control in the factory. However, the generation of cracks between the quality control and the installation at the PV plant is uncontrolled. Transportation, a rough handling and potentially inherent stress in the cells can generate cracks. A good result regarding at an Incoming Goods Test (IGT) the cracks are less than 20% of the PV modules exhibits 1 or 2 cells with cracks.
At the first years of operation, cracks are typical no issue for the power generation. Cracks can inactivate parts of the cell for the power generation, beside the power loss, additional follow-up damage can be caused by the strong electrical current through the remaining cell. In the worst case, burned hot spots will destroy the PV module.


